
ISPU’s fifth annual poll showcases American Muslim perspectives within the context of their nation’s faith landscape. Undertaken during a national lockdown due to COVID-19, American Muslim Poll 2020: Amid Pandemic and Protest provides researchers, policymakers and the public, insights and analysis into the attitudes and policy preferences of American Muslims, Jews, Catholics, Protestants, white Evangelicals, the non-affiliated, and the general public.
INTRODUCTION
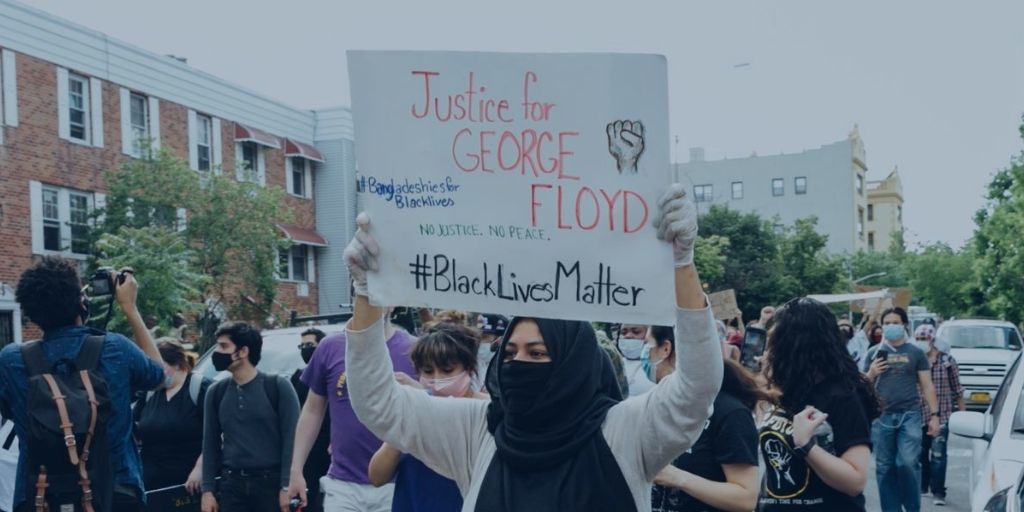
This year’s American Muslim Poll, the fifth annual survey of its kind, released shortly before a critical election, was meant to be historic. The fielding dates occurred amidst the historical COVID-19 pandemic and just months before another historic event: the massive uprising in pursuit of racial justice after the murder of George Floyd. This one-of-a-kind poll is a snapshot of the attitudes and perceptions of the American public, including underrepresented religious minorities such as American Muslims and Jews, during this unprecedented moment in American history.
The 2020 study reveals not only the presidential preferences of a diverse pool of American voters ahead of a critical election, but their perhaps surprising preferences regarding political alliances and political engagement beyond the ballot box. This year’s poll also tracks the impact of four years of a Trump presidency on American religious minorities, namely Muslims and Jews. These two groups are often pitted against each other, but are both targeted by a newly emboldened white supremacist movement. New data provides insight into how this affects Muslim-Jewish relations.
SUMMARY
The ISPU findings shed light on progress made over the last five years, especially in civic engagement, as well as challenges that persist for each of these faith communities.
Muslims Remain More Satisfied Than the General Public with the Direction of the Country
American Muslims are more likely than the general public and the non-affiliated to report being satisfied with the direction the country is taking (37% vs. 27% and 16%, respectively). Muslim satisfaction is on par with that of other faith groups (32–42% among Jews, Catholics, Protestants, and white Evangelicals). Looking over the past five years, the ISPU find that aside from a peak of 63% in 2016 and a low in 2018 of 27%, Muslims’ satisfaction with the country has mostly held steady with 41% reporting satisfaction in 2017, compared to 37% in 2020. Within the Muslim community, white Muslims (46%) are more likely than Black Muslims (28%), and Muslim men (41%) are more likely than Muslim women (31%) to report satisfaction with the direction of the country, reflecting the racial and gender trends of the country overall.
Though Higher Than Previous Years, Muslim Approval of President Trump Remains Lower Than Other Groups
Among Muslims, approval of President Trump’s job performance has increased from 13% in 2018 and 16% in 2019 to 30% in 2020. This is in contrast to the general public, for whom approval of President Trump has remained stable (35% in 2018 and 39% in 2019 and 2020). Again, The ISPU find gender and racial group differences in approval ratings. About one third of Muslim men (34%) approve of Trump, compared with one quarter of Muslim women (24%). Half of white Muslims (50%) approve of President Trump, compared with one fifth to one quarter of non-white Muslims (20% of Black Muslims, 21% of Arab Muslims, and 27% of Asian Muslims).
The racial breakdown in Trump’s approval within the Muslim community mirrors differences found among the general public; white Americans (48%) approve of the president more than their non-white counterparts (e.g., approval was 16% among Black Americans and 24% among Hispanic Americans). Nonetheless, American Muslim approval of President Trump is lower than other groups surveyed (30% of Muslims vs. 44% of Catholics, 46% of Protestants, 70% of white Evangelicals, and 39% of the general public).
Muslims Continue to Make Gains in Voter Registration, but Remain Lower Than Other Groups
In 2020, 78% of eligible Muslims report being registered to vote, a continued upward trend since 2016 (60%). In other words, the proportion of eligible Muslim voters who are not registered to vote has decreased by roughly half from 39% in 2016 to 21% in 2020. The ISPU also found fewer “insha’Allah voters” (those who intend to vote in an upcoming election but have not registered to do so) in 2020, where 78% are registered to vote and 81% say they plan to vote, a difference of only 3% between intentions and action (planning to vote and registering). In 2016, in contrast, 60% were registered to vote while 81% said they planned to vote, a difference of 21%. The number of voters who do not plan to vote remains constant at about 15% (14% in 2016 and 16% in 2020).
When Assessing Presidential Hopefuls, Muslim Support for Trump as Next Presidential Election Winner Has Climbed, but Remains Lower Than All Other Candidates
The IPSU survey field dates (March 17–April 22, 2020) occurred during a hotly contested Democratic primary and included the exit of Senator Bernie Sanders from the contest (April 8, 2020). As was the case in 2016, in 2020 American Muslims prefer a Democrat over a Republican for president (51% selected a Democrat as their candidate of choice, and 16% chose a Republican). Muslims (28%) are more likely than the general public (19%) to be undecided with respect to presidential vote choice. During the primary season, Muslims split their support among Democratic candidates: 29% report supporting Bernie Sanders, and 22% support Joe Biden. Among Muslims, 14% selected Trump as their candidate of choice in 2020, compared with 4% in 2016. Again, The IPSU found the relatively higher percentage in favor of Trump as the next president may be driven by the 31% of white Muslims who chose Trump, compared with 6–8% of non-white Muslims.
Muslims and the non-affiliated are the least likely to select Trump as their candidate of choice (14% of Muslims and 16% of the non-affiliated vs. 27% of Jews, 34% of Catholics, 39% of Protestants, 61% of white Evangelicals, and 30% of the general public).
Some variables of note that had no predictive power for both groups include support or opposition for coalition building between their faith community and pro-life or LGBTQ groups, the respondent’s gender, or their religious practice. Interestingly, support for Trump among Muslims and the general public is not predicted by religiosity.
Muslims Most Likely to Favor Coalition Building with Black Lives Matter
Months before the murder of George Floyd and the subsequent protests, nearly two thirds of Muslims (65%) express support for activists in their faith community to build coalitions with Black Lives Matter (BLM), compared with 54% of Jews, 42% of Catholics, 37% of Protestants, 30% of white Evangelicals, and 44% of the general public. Among Muslims, women (74%), youth (72% of 18–29-year-olds), and Black (72%) and Arab (62%) Muslims are more likely than men (58%), elders (56% of those 50+ years old), and white (58%) and Asian (58%) Muslims to support building such coalitions. Of all the political groups respondents were asked about building coalitions with, Muslims show the greatest support for coalition building with Black Lives Matter (65% with BLM vs. 49% with political conservatives on religious liberty issues, 47% with pro-life groups, and 39% with LGBTQ groups).
Muslims Split on Coalition Building with LGBTQ Groups, on Par with Catholics
Fifty-five percent of Muslims oppose forming political alliances with LGBTQ activists, similar to Catholics (61%). Opposition to such alliances is even more widespread among the general public (62%), Protestants (69%), and white Evangelicals (82%). Younger Muslims (48% of 18–29-year-olds) are more likely to support coalition building with LGBTQ groups, compared with older Muslims (38% of 30–49-year-olds and 26% of those 50+ years old). This same age trend exists in the general public.
Muslims Similar to White Evangelicals in Support for Coalition Building on Religious Liberty Issues and with Pro-Life Groups
Muslims and white Evangelicals are split in their support for allying with political conservatives on religious liberty issues (49% of Muslims and 53% of white Evangelicals favor vs. 47% of Muslims and 46% of white Evangelicals oppose). White Muslims (56%) favor such coalitions more than Asian (42%) and Arab (35%) Muslims.
Forty-seven percent of Muslims favor coalition building with pro-life groups while 46% oppose. Muslims show greater support than Jews (21%), Catholics (36%), and the general public (40%). White Muslims (57%) are more likely than Asian (40%) and Arab (41%) Muslims to support pro-life coalitions.
For the General Public, Political Ideology and Party Affiliation Predicts Islamophobia While Religiosity Does Not
We used regression analysis to identify predictors of Islamophobia for the general public and for Muslims. For the general public, holding a conservative political ideology and/or identifying as a Republican are associated with higher levels of endorsement of anti-Muslim tropes. Other factors associated with higher Islamophobia include less than a college education, lower income, being older (50+ years old), and reporting religious discrimination. Race and religiosity do not emerge as significant predictors of Islamophobia for the general public.
Interestingly, for Muslims, experience with religious discrimination is associated with being more likely to endorse anti-Muslim tropes. In fact, no other factors proved significant for Muslims. Looking more closely at experience with religious discrimination among Muslims, we find that white Muslims are most likely to report “regularly” experiencing religious discrimination (22% of white Muslims vs. 8–12% of non-white Muslims). Islamophobia is particularly high among this 22% of white Muslims.
For Muslims, Experience with Religious Discrimination Remains High
In 2020, Muslims and Jews are most likely to report experiencing any religious discrimination (60% of Muslims and 58% of Jews, compared with 26% of Catholics, 29% of Protestants, 43% of white Evangelicals, 27% of the non-affiliated, and 33% of the general public). Over the past five years, Muslim experiences with religious discrimination have remained steady, ranging from 60% to 62%. Reported experiences with religious discrimination among Jews, in contrast, have increased over time from 38% in 2017 to 58% in 2020.
Muslims Are More Likely Than Other Groups to Experience Religious Discrimination in Institutional Settings
The IPSU asked those who reported experiencing any religious discrimination about places where the discrimination may have occurred. Muslims are more likely than Jews and the general public to face religious discrimination in institutional settings such as at the airport (44% vs. 2% of Jews and 5% of the general public), when applying for jobs (33% of Muslims vs. 5% of Jews and 8% of the general public), in interactions with law enforcement (31% of Muslims vs. 2% of Jews and 8% of the general public), and when receiving healthcare services (25% of Muslims vs. 5% of Jews and the general public).
Muslims are also more likely to face discrimination on an interpersonal level such as at a restaurant or other public place (49% vs. 30% of Jews and 23% of the general public) and when interacting with peers at work or school (42% of Muslims vs. 22% of Jews and 24% of the general public). Muslims, Jews, and the general public are equally likely to experience religious discrimination from family and friends (30%, 27%, and 33%, respectively).
Unlike prior years, Muslim men are as likely as Muslim women to experience religious discrimination, in general and by setting.
RESULTS
Satisfaction with Direction of the Country and Presidential Approval
Muslims More Likely Than General Public to Express Satisfaction with Direction of Country
American Muslims (37%) are more likely than the general public (27%) to report satisfaction with the direction of the country (Figure 1). Muslims are also more likely than Americans with no religious affiliation (16%) to report they are satisfied with the direction of the country. Muslims are on par with Jews (33%), Catholics (34%), Protestants (32%), and white Evangelicals (42%) in their satisfaction with the direction of the country.
Muslim Satisfaction Has Held Mostly Steady since 2017
Looking at the last five years, American Muslim satisfaction with the direction of the country peaked in 2016 with nearly two thirds of Muslims (63%) reporting being satisfied (Figure 2). In 2017, the proportion satisfied dropped significantly to 41%. Since 2017, between one quarter and one third of American Muslims reported satisfaction with the way things are going in the country today (27% in 2018, 33% in 2019, and 37% in 2020), with a significant increase in satisfaction between 2018 and 2020.
Satisfaction Is Not Uniformly Expressed across the Muslim Community
In 2020, white Muslims (46%) are significantly more likely than Black Muslims (28%) to express satisfaction, while Asian and Arab Muslims are midway between (both at 38%). Additionally, Muslim men (41%) are more likely than Muslim women (31%) to report satisfaction with the direction of the country. This gender divide is also seen in the Jewish community (42% of men and 23% of women are satisfied) but not in any other faith or non-faith community.In 2020, white Muslims (46%) are significantly more likely than Black Muslims (28%) to express satisfaction with the direction of the country, while Asian and Arab Muslims are midway between (both at 38%).Click to Tweet
Muslim Approval of President Trump Doubled since 2019 but Varies across Muslims of Different Backgrounds
Of note, Muslim approval of President Trump increased from 13% in 2018 and 16% in 2019 to 30% in 2020 (Figure 3). Like satisfaction with the direction of the country, there is a notable fissure in the community along gender lines and, to an even greater degree, along racial lines. In terms of gender, Muslim men (34%) are more likely than Muslim women (24%) to approve of President Trump.
Looking at racial breakdowns, 50% of white Muslims approve of the way Donald Trump is handling his job as president, on par with 48% of white Americans in the general public. (Figure 4). In contrast, non-white Muslims are statistically on par with each other and are significantly less likely than white Muslims to express such approval, with 20% of Black Muslims, 21% of Arab Muslims, and 27% of Asian Muslims reporting approval of the president. Furthermore, non-white Muslims approve of President Trump at levels similar to non-white Americans in the general public (16% of Black Americans and 24% of Hispanic Americans).Non-white Muslims approve of President Trump at levels similar to non-white Americans in the general public (16% of Black Americans and 24% of Hispanic Americans).Click to Tweet
Among the general public, Trump’s approval remains unchanged in 2020 from 2019 at 39%. Despite the increase over time among Muslims, Muslim presidential approval remains significantly lower compared with other faith communities. Seven out of ten white Evangelicals approve of the president’s job performance, the highest among all faith and non-faith groups surveyed (Figure 3). Catholics (44%), Protestants (46%), and the general public (39%) are all more likely than Muslims (30%) to approve of President Trump. Jewish Americans are more likely than the non-affiliated to approve of the president (34% and 23%, respectively), but both are as likely as Muslims.
It is important to consider the context of the American Muslim Poll to better understand President Trump’s approval ratings. The poll was fielded in March 2020, during the height of the primary season, but also as schools and states rapidly shut down across the country and President Trump and the White House Coronavirus Task Force held regular briefings that included Director of the National Institute of Allergy and Infectious Diseases Dr. Anthony Fauci, an indication that the president saw COVID-19 as a crisis requiring federal response. Messaging from the president and his team described the virus as an “invisible enemy” that we are at “war” with, and leaders at all levels reminded the public that “we’re all in this together.” He also singled out international actors as responsible for the spread of COVID-19 in America. In short, the public looked to the president to lead the nation through this international crisis.
Political scientists dub this phenomenon the “rally round the flag” effect, when an initial show of unity around a crisis or war results in a (temporary) reduction in criticism of government policies and an increase in approval ratings among opposing groups. Gallup’s poll fielded within the time frame of the American Muslim Poll showed an uptick in presidential job approval, especially among Democrats and Independents. This may help to explain the marked increase in presidential approval among American Muslims.
Muslim Voting Trends over the Past Five Years
Muslim Voter Registration Continues to Climb but Remains Lower Than Other Faith Communities
American Muslim voter registration among eligible voters continues to lag behind other faith communities. Nearly four out of five Muslims are registered to vote (78%), compared with about nine out of ten from other faith groups (90% of Jews, 92% of Catholics, 88% of Protestants, 91% of white Evangelicals, and 87% of the general public) (Figure 5). Eighty-two percent of non-affiliated Americans are registered to vote, on par with Muslims.
Though lower than other groups, over time, Muslim voter registration continues to climb. The proportion of eligible Muslim voters not registered to vote has declined by about half from 39% in 2016 to 21% in 2020 (Figure 6).The proportion of eligible Muslim voters not registered to vote has declined by about half from 39% in 2016 to 21% in 2020.Click to Tweet
Fewer Muslims Are “Insha’Allah Voters”
In 2016, ISPU identified a segment of the Muslim community we coined the “insha’Allah voter,” those who intend to vote but have not registered to do so. In 2016, 60% of eligible voters were registered to vote by January of election year, but 81% said they planned to vote, a difference of 21% (Figure 7). In 2020, 78% of eligible voters were registered to vote by March of election year, and 81% planned to vote, a difference of only 3% who plan to vote but have yet to register, a significant reduction in the share of “insha’Allah voters.”
Number of Non-Voters by Planned Rejection Stays Constant
A constant segment of the eligible-to-vote Muslim population (roughly 15%) do not intend to vote (14% in 2016 and 2018, and 16% in 2020). In 2016, we asked why. The top reasons stated were:
- “My vote will make no difference”
- “No one represents my priorities”
Between 2016 and 2020, “get out the vote” campaigns have been tremendously successful in getting willing but not yet registered Muslim voters to register. This was accomplished in part through voter drives at mosques and Muslim conferences. The remaining 15% will require convincing their vote really matters and that the choices they are offered are worth their time, not just a convenient way to register to vote.
A Sizable Proportion of Muslims Are Not Eligible to Vote
A full quarter (26%) of Muslims in America cannot vote, mostly due to being non-citizens. This is much higher than any other faith or non-faith group. Only 7% of Jews, 1% of Catholics, 2% of Protestants, 4% of white Evangelicals and the general public, and 5% of those with no religious affiliation are not eligible to vote.
With 74% of American Muslims eligible to vote and only 78% of those registered to vote, this translates to only 57% of all Muslims in America registered to vote. As 1% of the population, with a quarter not eligible to vote, voting in national elections may not be the most effective way to assert political influence. The next generation of organizers may work to encourage greater participation in local political races where Muslims can make a difference with campaign contributions and volunteering, as well as voting.
Presidential Candidate Preferences
While Support for Trump Rose, Muslims Still Prefer Democratic President
At the time our survey was fielded, there were three Democratic presidential candidates (Joe Biden, Bernie Sanders, and Tulsi Gabbard) and two Republican candidates (Donald Trump and Bill Weld). Over the course of our survey field period, Bernie Sanders, Tulsi Gabbard, and Bill Weld dropped out of the race. As candidates ended their campaigns, they were removed as response options to the question, “If the presidential election were held today, who would you want to win?.” This question was asked of all respondents regardless of voting eligibility.
Muslims overwhelmingly prefer a Democrat for president, both in 2016 and in 2020. In 2016, 67% of Muslims chose a Democrat as their candidate of choice, while 16% chose a Republican. In 2020, 51% selected a Democrat, compared with 16% who selected a Republican. More Muslims were still undecided in March 2020 than were in January 2016. This may be partially driven by a difference in response choices to the question between the two years. In 2020, respondents had the option to select “undecided” (28%), while in 2016 response options included “none of these” (5%) and “don’t know” (15%).Muslims overwhelmingly prefer a Democrat for president, both in 2016 and in 2020.Click to Tweet
Support for President Trump’s reelection climbed 10% between 2016 and 2020 (4% vs. 14%, respectively) among Muslims (Figure 11). Upon closer examination, we find that this increase is partially driven by white Muslims being more likely than non-white Muslims to select Donald Trump as their presidential candidate of choice. Nearly one third of white Muslims (31%) chose Donald Trump, compared with 8% of Black and Arab Muslims and 6% of Asian Muslims.
These findings on candidate preference are in line with findings reported earlier on approval of President Trump, approval of whom jumped between 2019 and 2020 and is driven mostly by white Muslims who are on par with their racial counterparts in the general public.
A Sizable Proportion of Muslims Are Undecided
Almost one third (28%) of Muslims are undecided on who they prefer for the next president as of March 2020, more than Jews (12%), Protestants (12%), white Evangelicals (10%), and the general public (19%). Twenty-two percent of Catholics and the non-affiliated are undecided, on par with Muslims. Muslim women are more likely than Muslim men to be undecided (33% vs. 24%).
The Islamophobia Index
2020 marks the third year the Islamophobia Index was measured in the American Muslim Poll. The Islamophobia Index is a measure of the level of public endorsement of five negative stereotypes associated with Muslims in America. These are the items used to construct the index:
Please indicate how much you agree or disagree with the following statements, where 1 means you strongly disagree and 5 means you strongly agree in regards to most Muslims living in the United States.
- Most Muslims living in the United States are more prone to violence than other people.
- Most Muslims living in the United States discriminate against women.
- Most Muslims living in the United States are hostile to the United States.
- Most Muslims living in the United States are less civilized than other people.
- Most Muslims living in the United States are partially responsible for acts of violence carried out by other Muslims.
ISPU analysts chose these five variables based on previous research [2] linking these perceptions with greater tolerance for anti-Muslim policies such as mosque surveillance, racial profiling, and greater scrutiny of Muslims at airports, the so-called Muslim Ban, and even taking away voting rights from Americans who are Muslims. These five measures are not meant to cover the totality of public Islamophobia, which can and does include many other false beliefs about Muslims. They are instead meant to offer an evidence-based measure of five perceptions known to be linked to acceptance of discriminatory policies.
Answers to this battery of questions were used to construct an additive scale that measures overall anti-Muslim sentiment. [3] The resulting Islamophobia Index provides a single metric that is easy to understand, compare, and track over time. The Islamophobia Index measures the endorsement of anti-Muslim stereotypes (violent, misogynist), perceptions of Muslim aggression toward the United States, degree of Muslim dehumanization (less civilized), and perceptions of Muslim collective blame (partially responsible for violence), all of which have been shown to predict public support for discriminatory policies toward Muslims. [4]
It is noteworthy that this index, while called simply the “Islamophobia Index,” only measures anti-Muslim sentiment among the public and not the degree to which Islamophobia is institutionalized by the state. Islamophobia is not simply a phenomenon of societal sentiment, but is a structural phenomenon, manifesting in legislation, budget decisions, and law enforcement practices at the local, state, and federal levels. While our index does not measure structural Islamophobia, public tolerance for many of these practices is linked to higher scores on the Islamophobia Index. [5]
Politics, Not Religion, Predicts Islamophobia
To gain more insight into Islamophobia among the general public and Muslims, we analyzed the data using linear regression to determine which variables are linked to higher or lower scores on the Islamophobia Index.
Among the general public, several factors emerge as significantly associated with higher Islamophobia.
Political party and ideology. Identifying as a Republican and/or holding political ideology other than very liberal are associated with higher Islamophobia for the general public. Such associations among the general public with the Republican party and conservative political ideology may shed light on why just 11% of Muslims identify as a Republican and 14% plan to vote Republican in the 2020 election (compared with 53% who say they will vote Democrat).
Socioeconomic status. Being poor (having an annual income below $30,000) and/or holding less than a college education are associated with greater levels of anti-Muslim prejudice in the general public.
Experience with religious discrimination. Having experienced any religious discrimination is associated with more Islamophobia in the general public.
Factors not significantly associated with Islamophobia include race, religiosity (frequency of religious attendance and importance of religion), and religious affiliation. These findings suggest that conservatives in the general public who also believe that they are discriminated against for their faith are more likely to endorse anti-Muslim tropes. In other words, experiencing religious discrimination among conservatives is not seen as being in “common cause” with another religious minority also experiencing religious discrimination but, rather, in opposition to them. These findings also suggest that Islamophobia is driven by political ideology and not religious differences since, all else being equal, religious affiliation was not a significant predictor of Islamophobia.
For Muslims, the only factor significantly linked to higher Islamophobia is experiencing religious discrimination. So, Muslims who have experienced religious discrimination are significantly more likely to endorse anti-Muslim tropes. This suggests that this negative experience was perhaps interpreted as partially the outcome of the “bad behavior” of other Muslims, instead of the misinformation or individual bias of the aggressor.
White Muslims Reporting Regular Discrimination Are More Likely to Have Islamophobic Views
To better understand Islamophobia among Muslims, especially those experiencing religious discrimination, we looked at the frequency of discrimination (never, rarely, occasionally, regularly). We found that white Muslims were the most likely to report experiencing “regular” religious discrimination (22% compared with between 8% and 12% among non-white Muslims) (Figure 24). Among this 22% of white Muslims who experience religious discrimination “regularly,” Islamophobic views are especially prevalent. For a fuller discussion of internalized Islamophobia among Muslims, see American Muslim Poll 2018: Pride and Prejudice.
Experiences with Religious Discrimination and Bullying
Religious Discrimination of Muslims Remains High
We asked Americans about their personal experiences with religious discrimination in the year prior to the survey:
“How often, if at all, have you personally experienced discrimination in the past year because of your religion?”
Muslims and Jews are the most likely groups to experience any religious discrimination (60% of Muslims and 58% of Jews, compared with 26% of Catholics, 29% of Protestants, 43% of white Evangelicals, 27% of the non-affiliated, and 33% of the general public) (Figure 25). White Evangelicals are more likely than Catholics, Protestants, the non-affiliated, and the general public to report facing religious discrimination.
Muslims’ frequency with religious discrimination has held steady for five years, with 60–62% of Muslims reporting that they faced discrimination in the year prior to the survey (Figure 26). Our findings are in line with the rise in hate crimes against Jewish people and houses of worship. In 2017, 38% of Jews reported experiencing religious discrimination, compared with 58% in 2020, bringing them on par with Muslims.
Muslims Uniquely Experience Institutional Religious Discrimination
For those who reported any level of religious discrimination, we asked about different settings where the discrimination may have occurred. What makes Muslims unique is not that they experience religious discrimination—Jews report this experience at equal frequencies in 2020. Instead, it is the way Muslims experience this discrimination. More than any other group that experiences religious discrimination, Muslims do so on an institutional, not just interpersonal, level. This includes at the airport (44% of Muslims vs. 2% of Jews and 5% of the general public), when applying for a job (33% of Muslims vs. 5% of Jews and 8% of the general public), when interacting with law enforcement (31% of Muslims vs. 2% of Jews and 8% of the general public), and when receiving healthcare (25% vs. 5% of Jews and the general public) (Figure 27). Of all the places we asked about, the airport is the most frequent place of perceived institutional religious discrimination among Muslims, at 44%.More than any other group that experiences religious discrimination, Muslims do so on an institutional, not just interpersonal, level.Click to Tweet
Muslims Higher on Interpersonal Religious Discrimination
In contrast, all who experience discrimination because of their faith are equally likely to perceive this coming from family and friends (30% of Muslims, 27% of Jews, and 33% of the general public) (Figure 28). Muslims, however, are still more likely than others to face interpersonal discrimination when interacting in a public place such as a restaurant (49% of Muslims vs. 30% of Jews and 23% of the general public) and when interacting with peers at work or school (42% of Muslims vs. 22% of Jews and 24% of the general public).
Muslim Men and Women Report Similar Experiences of Discrimination
Though Muslim women have consistently reported religious discrimination more often than men in years prior, this year (2020) there is no statistical difference by gender (57% of Muslim men and 65% of Muslim women). Muslim men and women who report experiencing discrimination also did not differ as to where they experienced it. Men and women were equally likely to say they experienced discrimination at the airport (42% of men and 47% of women), when interacting with law enforcement (33% of men and 28% of women), when applying for a job (34% of men and 32% of women), at their place of work or school (37% of men and 47% of women), when interacting with friends or family (31% of men and 29% of women), and when receiving healthcare services (29% of men and. 20% of women). Surprisingly, they also were equally likely to report experiencing it from the public (45% of men and 53% of women, which are statistically on par).
Muslim Families Most Likely to Report a Child Has Faced Religious-Based Bullying
We asked survey participants who have child(ren) attending a K–12 public school, “How often, if at all, have your children experienced bullying, such as insults or physical assaults in the past year because of their religion at school?.” The findings are stark. In 2020, half of Muslim families with a child or children in K–12 schools say their child has been bullied for their faith in the past year (51%) (Figure 29). This compares to 42% in 2017, when we last asked this question, which is statistically on par with what we found in 2020.
The proportion of Muslim families reporting that their child has faced religious-based bullying in 2020 is nearly double the level of families in the general public (51% among Muslims vs. 27% among the general public).The proportion of Muslim families reporting that their child has faced religious-based bullying in 2020 is nearly double the level of families in the general public.Click to Tweet
We subsequently asked these families, “Who has bullied your child?,” and asked them to select all responses that apply. In 30% of the instances for Muslim families, the bully was a teacher or other school official. Sixty-nine percent of these families reported the bully was another student or group of students. Bullying persists as a problem and must be dealt with head on, especially when its source is an adult responsible for educating and protecting the child.

METHODOLOGY
ISPU created the questionnaire for this study and commissioned Social Science Research Solutions (SSRS) to conduct a nationally representative survey of self-identified Muslims and Jews and a nationally representative survey of the general American public. Researchers examined the views of self-identified Protestants (parsing out white Evangelicals), Catholics, and the non-affiliated. White Evangelicals are routinely studied in religion survey research as a separate subgroup due to their unique social and political characteristics (see, for example, this survey by the Public Religion Research Institute [PRRI] and this study by the Pew Research Center). In our analysis, we make comparisons among age and racial groups. For race comparisons among the Muslim sample, we do not include Hispanic Americans or Native Americans in the racial comparisons due to small sample sizes. In the general public, the IPSU exclude Asian Americans in racial comparisons due to small sample size. A total of 2,167 interviews were conducted. ISPU owns all data and intellectual property related to this study.
SSRS conducted the survey of Muslims, Jews, and the general population for the ISPU from March 17 through April 22, 2020. Prior to the field period, SSRS programmed the study into Confirmit for both the phone/Computer Assisted Telephone Interviewing (CATI) and web portions of the study. Extensive checking of the programs was conducted to ensure that skip patterns and sample splits followed the design of the questionnaire. The study investigated the opinions of Muslims, Jews, and the general population regarding politics, important issues facing the country, faith customs, and religious discrimination.
SSRS interviewed 801 Muslim respondents, 351 Jewish respondents, and 1,015 general population adult respondents, yielding a total of 2,167 respondents surveyed. The interviews were completed by phone and on the web. Among Muslim respondents, 360 interviews were completed over the phone, and 441 were completed via web panel. All 351 interviews with Jewish respondents were completed by phone. A total of 933 interviews were completed with general population adults via the SSRS probability panel and 82 by phone with non-Internet respondents. Non-Internet respondents are respondents who do not use the Internet and do not have access to the Internet. In total, 468 interviews were completed via cell phones, 325 via landline phones, and 1,374 via web survey.
The sampling procedures were designed to efficiently reach the target populations of interest. These procedures are listed below:
- SSRS pulled a sample of households prescreened as Muslim in its weekly national omnibus from the years 2013–2020 to recontact for this study.
- SSRS pulled a sample of households prescreened as Jewish in its weekly national omnibus from the years 2017–2020 to recontact for this study.
- SSRS purchased listed samples in both landline and cell phone frames. The landline sample was purchased from Experian, and the cell phone sample was purchased from Smart Cell. Experian and Smart Cell are sample providers with specific characteristics flagged for each piece of sample. Experian and Smart Cell provided sample with flags for Muslim households.
- In order to supplement the number of Muslim interviews that were needed, SSRS employed a web panel and completed 441 Muslim interviews via an online survey with sample from a non-probability panel. There were no systematic differences between the two samples.
- SSRS sampled from their probability-based web panel to administer the general population portion of the survey. These are respondents who participate in the SSRS panel, having been invited either via their completion of the SSRS weekly omnibus (RDD sample) or by mail (ABS sample). Among the general population sample, SSRS also oversampled Catholics and white Evangelicals in the panel to guarantee at least 200 completes in each religious group in accordance with the design of the study.
- In order to fully represent the general population, SSRS interviewed 82 non-Internet respondents by telephone. SSRS sampled prescreened non-Internet households from the year 2019 of its weekly national omnibus survey to recontact for this study.
Survey data were weighted to: 1) adjust for the fact that not all survey respondents were selected with the same probability, and 2) account for non-response across known demographic parameters for the Jewish and Muslim adult populations. Weighting procedures accounted for key demographic variables including age, race, gender, region, education, marital status, number of adults in the household, voter registration, phone usage, and political party identification. The survey has a margin of error at a 95% confidence level of Muslims ±4.8% and Jews ±7.2%.
The study was weighted to provide nationally representative and projectable estimates of the adult population 18 years of age and older. The weighting process takes into account the disproportionate probabilities of household and respondent selection due to the number of separate telephone landlines and cell phones answered by respondents and their households, as well as the probability associated with the random selection of an individual household member. The survey has a margin of error at a 95% confidence level of the general population ±3.7%. All statistically significant findings in this report are based on a 95% confidence interval.